Our Investment Philosophy
We use a Fact-Based Investment Strategy to provide Dynamic Risk Management.
Our core beliefs are:
· We don’t know where the market will go – and neither does anyone else
· Wherever the market goes, it will get there by trending
· Along the way, there will be outperformers and underperformers.
Armed with these three core beliefs, we are well equipped to handle whatever the market brings - all without having to make a single prediction. Using supply and demand analysis, our Fact-Based strategy concentrates on identifying market trends to determine market exposure and identifying outperformers to include in our portfolios. Together, they give us the "when" and "what" the two essential ingredients of success.
Establishing Your Risk Tolerance
We build portfolios that fit your risk using quantitative math and psychological theory. Traditionally advisors only used a subjective risk questionnaire to assign risk tolerance. Subjectivity suggests, if you are young you must be chasing aggressive growth and, if you are of retirement age you must be extremely conservative, etc.)
We use math to pinpoint your exact risk tolerance. Using an award-winning technology that is based on a noble prize winning framework, we quantify your risk tolerance into a simple Risk Number between 1 – 99. This is based on the actual dollars that you have today, to assess how much you are willing to risk (or lose) in exchange for an opportunity at a specific gain. This results in a quantified and objective outcome which is customized for you alone.
Constructing Your Portfolio
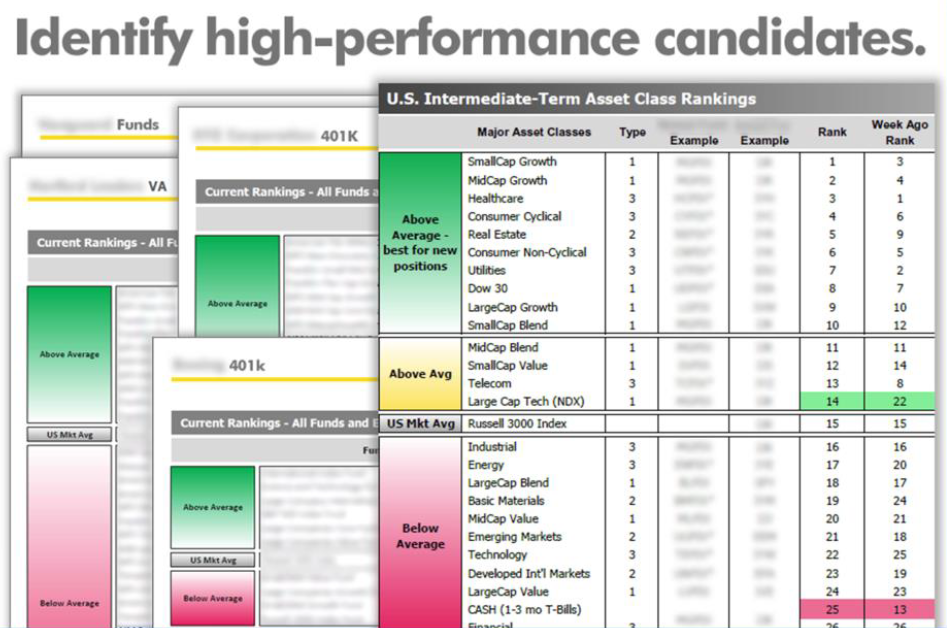
Once we have established your risk number, we look at the when - (Technical Indicators) and the what - (Investment Ranking Tables) to create your “customized portfolio”. Your portfolio is comprised of multiple asset classes. Each asset class has risk associated to it when the asset classes are blended together it creates your customized portfolio and will have a weighted average of risk from the asset classes and the tactical management as part of its total risk score. We can adjust the risk up or down by increasing or decreasing exposure to Fixed Income or Equity security. Your customized portfolio will be rebalanced monthly or quarterly based on the asset classes, ranked positions and the status of the Technical Indicator.
Your Customized Portfolio and Risk Tolerance:
Using your risk number to determine portfolio construction
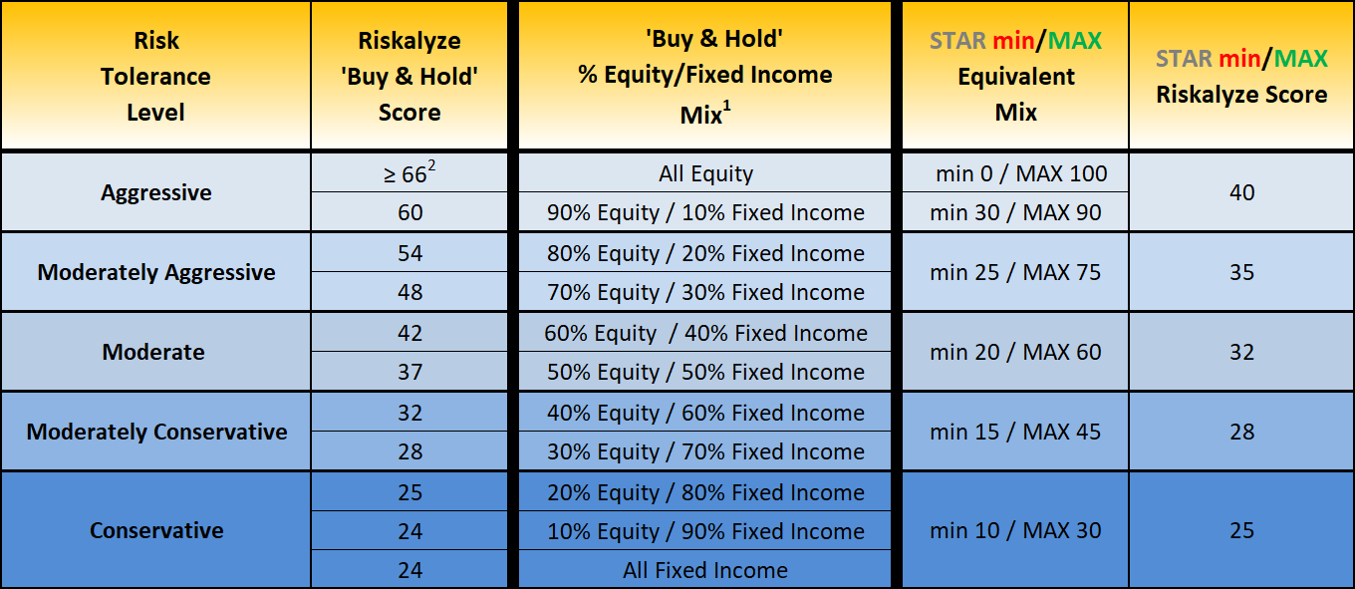
RAT Min/Max
This model combines relative-strength rankings, current Market trends, and predetermined minimum and maximum Equities exposure. It provides a very effective way to deal with typical High, Medium, Low "investor risk profile" considerations and is a great choice for 401k and other retirement accounts. Acting on quarterly intervals it fits easily into restricted 401k or 403b plans.
BOSS/Bull Bear
Emphasis is on the longer-term Bull and Bear cycles in the U.S. Moves completely in or out of the market. When the Bull/Bear indicator is negative, is 100% out of the market and when it is positive, is 100% in the market. The asset classes in this model are chosen and reallocated quarterly.
Technical Market Indicators Appendix
Bull-Bear Indicator
The Bull-Bear Indicator is constructed from specific market measurements and is intended to show the relationship between supply and demand at the longer-term timeframe of months to years. When the Bull-Bear Indicator is in a Bull Market mode and then crosses over the Bear Market Threshold, a new Bear Market is signaled. When the Bull-Bear Indicator is in a Bear Market mode and then crosses over the Bull Market Threshold, a new Bull Market is signaled. Once a mode (Bull or Bear) is established, it is considered to remain in place until the Bull-Bear Indicator eventually crosses over the opposite threshold.
Quarterly Trend Indicator
Provides a quarter-by-quarter look at the probable risk environment of each quarter, using the trend status of US and International equities. The trend labeling is derived from the Russell 3000 for the US, and the MSCI Ex-US for International. If either the US or International equities are in an uptrend, a lower-risk quarter is indicated; if neither the US nor International equities are in an uptrend, a higher-risk quarter is indicated.
Balance of Strength Signal
BOSS compares a long-term and a short-term assessment of how Cash rises and sinks in the rankings, vs. those 16 asset classes that comprise ‘the market’ (for BOSS’s purposes). In doing so, BOSS seeks to avoid downside-volatility via an occasional ‘go to Cash’ directive, without typically remaining in Cash for a period that proves to be in excessive defiance of an overall, larger uptrend.
Investment Ranking Methodology
The Ranking Tables are constructed by measuring performance characteristics of the candidates, aggregating the measurements, and then ranking the candidates in descending order of aggregate measurements. The performance characteristics measured include price performance over four timeframes (the past 30, 60, 120 and 240 market days), performance on "market-up" days vs. performance on "market-down" days, nearness to 52-week highs, and several other performance-based measurements. The specific measurements have been chosen to highlight those performance characteristics that are likely to persist for at least several months. These performance-based measurements are classified as "momentum" types of measurements in the academic literature, and the ranking that results from them is called a "relative strength" ordering in academic studies. The higher-ranked candidates are typically selected for inclusion in portfolios, while lower-ranked candidates are removed from portfolios, at intervals usually ranging from 1 to 4 months between such selections.